
Boks have statistical edge over Wales
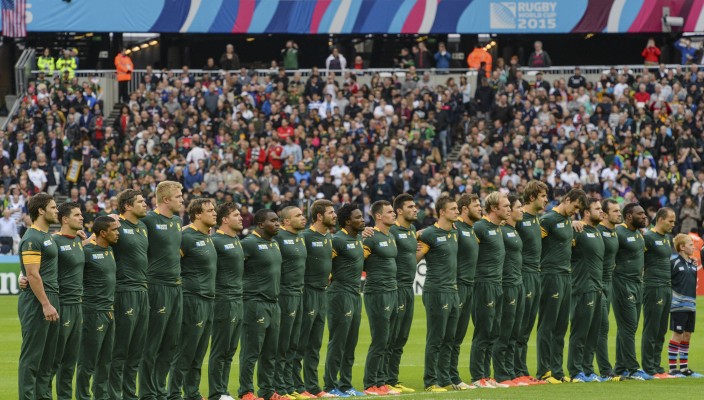
The statistics taken from the Vodacom Rugby App suggest South Africa will go into their Rugby World Cup quarterfinal against Wales in London on Saturday as the firm favourites.
Although they started their campaign with a whimper, the Springboks steamrolled their way into the quarterfinals thanks to a 10-try defeat of the United States.
While both teams lost a match during the pool stages the stats show how the Boks overshadow the Welsh in almost every single area of the game.
The Springboks scored double the amount of tries compared to Wales with South Africans scoring 22 to the 11 by Wales.
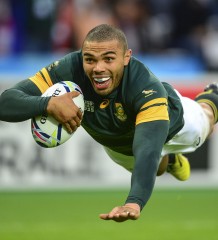
South African flyer Bryan Habana tops the try-scoring rankings with five to his name while scrumhalf and captain Fourie du Preez made the most try assists with six.
The statistics show that South Africa not only kicked slightly more than their upcoming opponents but will pose an attacking threat.
South Africa made 2115 running metres from 536 carries which translated into 44 clean breaks and beating 114 defenders in their four pool matches.
Compared to the Welsh they ran 378 more metres while they made 11 more clean breaks and beat 36 more defenders while their opponents also made 77 fewer carries.
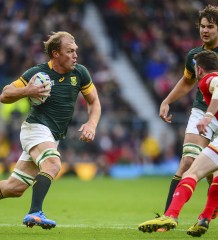
Centre Damian de Allende has been one of the Springboks’ sharpest weapons in their artillery with the fleet-footed player topping the defenders beaten category with 18 behind his name.
The Springboks will have to improve on their discipline as they have conceded 49 penalties which averages close to 12 per match while Wales are not far behind with 45 calls going against them in their four matches.
While South Africa has been costly with the penalties conceded they were also callous in taking the points on offer missing nine conversion kicks.
The Boks can expect a proper battle for breakdown ascendency as the Welsh have won the third most turnovers with 37 compared to the 26 by South Africa.
South Africa’s young lock pair of Lood de Jager and Eben Etzebeth will have their work cut out as they go up against the top lineout team in the competition.
The Welsh won 60 lineouts on their own throw compared to the 49 by South Africa with De Jager and Wales’ Luke Charteris winning 20 apiece.
De Jager has been one of South Africa’s most valuable players with the towering lock executing 50 tackles which is the third best in the competition so far.
If you consider yourself an armchair expert, you can be on the winning side from the comfort of your couch.
Play the Predict-a-Stat game on the Vodacom Rugby App and stand a chance to win a Samsung smartphone each week until the Webb Ellis Cup has been won.
If you don’t have it, get it! If you’ve already got it, upgrade it!
All the games, all the teams, all the stats – at your fingertips
Rugby World Cup – Team-vs-Team Statistics:
South Africa v Wales
Carries: 536-459
Clean breaks: 44-33
Conversions: 14-10
Defenders beaten: 114-78
Drop goals: 1-0
Handling errors: 28-34
Kicks caught: 114-114
Kicks from Hand: 148-133
Knock ons: 22-30
Lineouts stolen: 6-5
Lineouts won on own throw: 49-60
Loose ball collected: 63-72
Metres run: 2115-1737
Missed conversions: 9-1
Missed penalty goals: 0-1
Missed tackles: 48-65
Offloads: 31-21
Passes: 677-518
Penalties conceded: 49-45
Penalty goals: 10-12
Points: 171-111
Tackles: 464-436
Tries: 22-11
Try assists: 12-5
Turnovers won: 26-37
Yellow cards: 2-1
Photo: ©Barry Aldworth/eXpect LIFE
Related Posts

« VOORSKOU: BLOU BULLE TEEN WESTELIKE PROVINSIE #PaleToe IRELAND Team for Rugby World Cup Quarter-Final clash against Argentina »